After more than 50 years, half of it as a registered futures broker or commodity trading advisor, I’m not surprised when the market teaches me a lesson—including some I should have learned before.
Time value decay is one of them. Yes, it’s something we all do with age, but in this case it’s a factor affecting profitability of options. Puts and calls lose value as their expiration date approaches, and the rate of this decline accelerates as the clock winds down.
This makes options a bit like musical chairs, where you walk quickly while the music plays but to win you must be seated when the music stops. Options that can’t be exercised at a profit expire worthless. As expiration approaches, options lose remaining value faster and faster – until the music finally stops. This makes the timing of exiting positions crucial. The later you bail out of an option the more you lose, which is the lesson the market again taught me recently.
How does this happen? Taking the cover off the inner workings of puts and calls reveals lots of math, full of symbols you may vaguely remember from high school or maybe college: differential equations, log-normal distributions, trigonometry and the like. All of this is built off the notion that markets never allow reward without risk.
I’ll stop there because your eyes are probably already glazing over. Suffice it to say that the value of an option is whatever someone will pay for it. But there’s no free lunch. They always cost something.
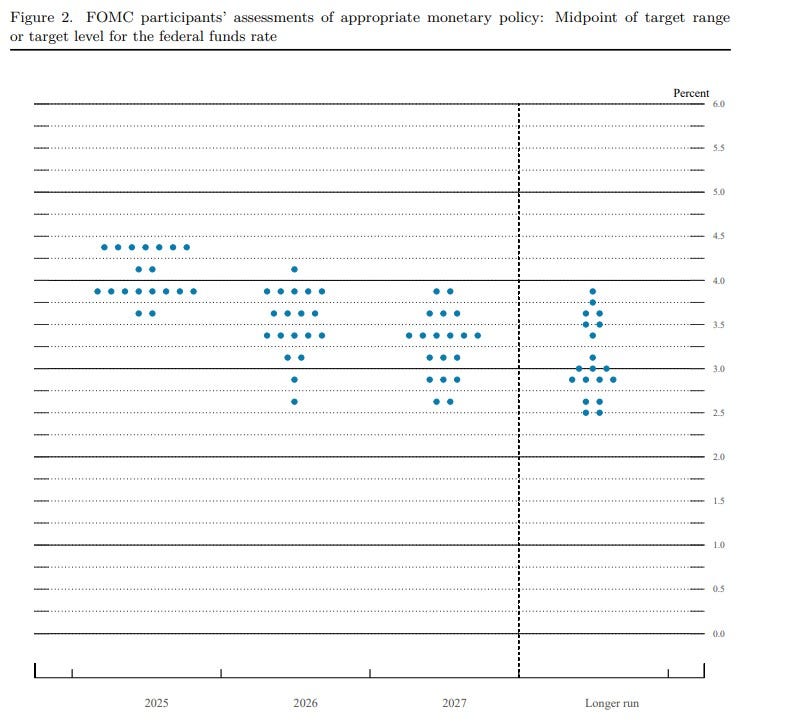
The Fed connects the “Dots”
Some options geeks start with their estimate of what a put or call is worth and then use it to determine what the market is really saying about the future. This analysis comes with plenty of assumptions, including interest rates. Changing the assumed rate changes the estimate of everything from land prices to production costs.
While markets ultimately set interest rates, the cost of borrowing funds for immediate use—short-term rates —usually trades within a range targeted by the Federal Reserve’s statement on monetary policy, which is updated eight times a year, including June 18, when it was kept at 4.25% to 4.50%.
The latest Fed statement was unanimous, as most of these are. But individual officials at the meeting do have differing opinions about where their policies may be headed. These are summarized with the so-called DOTS—a chart that plots the SEP, or summary of economic projections, about the path of interest rates, GDP growth, unemployment and inflation through 2027 and beyond.
The latest DOT plots scaled back growth by one-quarter of 1% while raising unemployment and inflation slightly, suggesting how tariff costs will pass through the supply chain to consumers and businesses. Fed officials voting at the June 18 meeting believe cuts will start soon, with a majority seeing a second ¼ of 1% cut by the end of the year. That would take short-term Federal Funds to a range of 3.75% to 4% or less, affecting prices and profits in the here and now, and beyond.
$5 corn costs
The latest wrinkle arrived a few hours before the Fed decision June 18, when USDA’s Economic Research Service updated cost-of-production estimates for the corn and soybeans that farmers will harvest in the 2025-26 marketing year that begins around Sept. 1 in most places. The agency increased its estimate of costs by about a nickel per bushel for corn and a penny for soybeans, and also presented forecasts for 2026 crop costs, which to no one’s surprise are higher by around 2%.
The biggest change since the government’s last estimates in November for 2025 crop expenses was probably not a surprise either to anyone who writes the checks: Fertilizer bills jumped 10%, and this was before the bombs started falling in Iran. Surprise or not, higher costs threaten to squeeze profit margins even more, though USDA’s June 12 World Agricultural Supply And Demand Estimates kept its forecast for 2025 crop corn prices unchanged at $4.20 a bushel. USDA’s latest corn cost estimate is $897 for 2025 and $916 for 2026, or around $4.93 a bushel and $5.03 based on yields of 182 bpa.
USDA production cost totals may look high because they include everything but the kitchen sink—the full economic burden of production, including line items like depreciation and a placeholder for family living withdrawals. But the direction of change is unmistakable.
USDA, and the Fed as well, didn’t try to game out the impact of tariffs and other trade and non-trade policies. USDA made that clear from the first line of its latest updates: “The WASDE report only considers trade policies that are in effect at the time of publication and assumes that these policies remain in place for the duration of the forecast period.”
Federal Reserve Chairman Jerome Powell ignored President Trump’s call for an interest rate cut of 2% or more, and sidestepped questions about the future at his post-meeting press conference.
“Right now, it’s a forecast in a very foggy time,” said Powell at what he —and pretty much everyone else—expects is one of the last press conferences of his tenure at the helm of the central bank. “No one holds to these rate paths with a high level of conviction.”
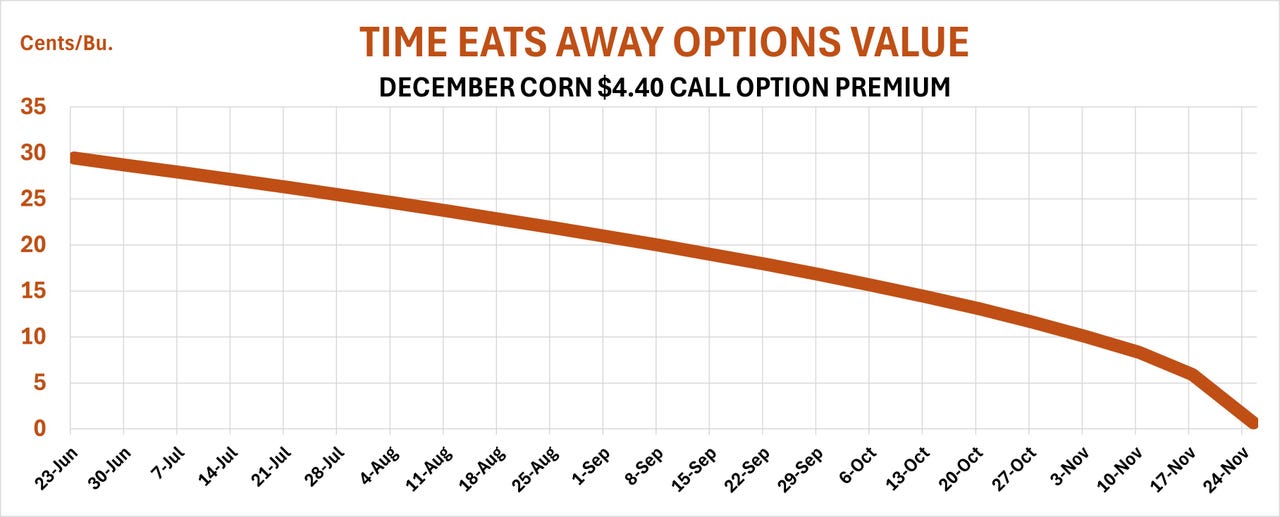
How options fade
The Fed doesn’t predict corn prices, but that same level of uncertainty extends to crops. The growing season is long and the trend is clear: A good crop should continue to pressure prices. That includes the value of options.
Consider what might happen to an at-the-money December corn call. The December $4.40 strike closed at just under 30 cents before the Juneteenth break. If prices and implied volatility, a gauge of uncertainty, are held constant, the option would slowly leak value this summer before the rate of losses begins steepening after Labor Day. The decline really gains steam in the last month of the options life in November.
Deciding whether to fish or cut bait with these contracts is tough. By Halloween, the value of the option would be down to a dime, a loss of nearly 20 cents. Losing the rest would hurt but so would missing a late and unexpected rally. As I found out, dithering over when to let go locks you into holding out for good—and losing everything.
The Juneteenth Federal holiday probably helped calm markets, though financial futures kept trading until Europe shuttered for the session. The biggest victim of all the chaos likely was the U.S. dollar, which melted to fresh 40-month lows early in the week because investors abandoned dollar-denominated safe havens like U.S. Treasuries. This probably isn’t a permanent rejection of the greenback’s status as the world’s reserve currency. It did reflect investors’ belief in buying a little of everything as they got ready to hunker down.
A weaker dollar doesn’t really impact exports of U.S. crops, but it does affect prices around the world, including those from competitors whose crops are valued in other currencies. This could be seen clearly last week when wheat prices jumped 25 cents. Weather in the U.S., the former Soviet Union and China were one cause, but the dollar slump figured in, too.
Uncertainty around the dollar and its impact on commodities adds to the premiums that options sellers demand, just one more reason to make sure you understand how the position will fare before learning a costly lesson.